A Comprehensive Look at a global issue
FATAL CAR ACCIDENT STATISTICS
%20--%3e%3csvg%20version='1.1'%20xmlns='http://www.w3.org/2000/svg'%20xmlns:xlink='http://www.w3.org/1999/xlink'%20x='0px'%20y='0px'%20width='626.7px'%20height='367.5px'%20viewBox='0%200%20626.7%20367.5'%20enable-background='new%200%200%20626.7%20367.5'%20xml:space='preserve'%3e%3cg%20id='Õ_xBA__x2264__x201E__x5F_1'%3e%3c/g%3e%3cg%20id='Õ_xBA__x2264__x201E__x5F_4'%3e%3cg%3e%3cdefs%3e%3crect%20id='SVGID_1_'%20width='626.7'%20height='367.5'/%3e%3c/defs%3e%3cclipPath%20id='SVGID_00000138556655236404614340000004266062373704617399_'%3e%3cuse%20xlink:href='%23SVGID_1_'%20overflow='visible'/%3e%3c/clipPath%3e%3cg%20id='Group_3'%20clip-path='url(%23SVGID_00000138556655236404614340000004266062373704617399_)'%3e%3cpath%20id='Path_3'%20fill='%23DFE1E3'%20d='M395.2,16.4c0.1,4.3-1.4,10.5-26.1,16.3c-36.2,8.5-68.8,16.3-98,25%20c-41.1,12.3-53.6,47.7,1.3,61.1c14,3.4,34.1,7.2,55.8,11.9C500,168.3,397.9,258,274.9,273S41.3,318.6,0,367.5h280.4%20c3-2.2,6-4.4,9-6.5c27.7-19.3,57-35.6,86.5-50.7c14.8-7.6,29.7-14.8,44.6-21.9l22.1-10.7c7.3-3.6,14.6-7.3,21.2-11.2%20c6.7-3.8,13.1-8.2,19.1-13.1c5.9-4.7,11.2-10.2,15.9-16.1c4.5-5.8,8.1-12.3,10.6-19.2c1.2-3.4,2-6.9,2.5-10.4%20c0.2-1.7,0.4-3.5,0.4-5.2c0-0.9,0-1.7,0-2.5c0-0.4-0.1-0.8-0.1-1.2l-0.1-0.5c0-0.1-0.1-0.4,0-0.3l-0.2-1.1%20c-0.4-7.1-3.7-14-8.9-20.1c-5.2-6.1-11.9-11.4-19.1-16.1c-7.4-4.7-15.1-8.9-23-12.6c-8-3.8-16.2-7.2-24.6-10.5%20c-16.7-6.6-33.7-12.4-50.8-18.5c-8.5-3.1-17-6.4-25.5-9.8c-13.2-5.1-30.5-15.4-32.8-17.4c-11.3-10-7.4-18.1-0.8-22.8%20c4.3-2.9,8.7-5.4,13.4-7.7c4.2-2,8.4-3.8,12.7-5.5c8.5-3.3,17-6.3,25.5-9.4s17-6.1,25.1-9.7c4.1-1.7,8-3.8,11.7-6.2%20c1.8-1.1,3.5-2.5,5-4c0.7-0.7,1.3-1.5,1.7-2.4c0.2-0.4,0.4-0.8,0.5-1.3c0-0.2,0.1-0.3,0.1-0.6l0.1-0.8c-0.1-1.9-0.8-3.7-2.2-5.1%20c-1.5-1.5-3.2-2.8-5-3.9c-3.9-2.1-8.1-3.7-12.3-4.9c-8.7-2.3-17.6-4-26.5-5c-9-1.1-18-1.8-27-2.2C335.7,0.1,395,5.7,395.2,16.4'%20/%3e%3cpath%20id='Path_4'%20fill='%23DFE1E3'%20d='M560.9,145.5c-39.6-21.2-116-45.1-153.4-54.9c-25.5-6.7-19.1-19-1.2-26.4%20c18.4-7.6,50.2-22.2,45-43.5c-6.5-26.4-102-20.1-102-20.1c9,0,18.1,0.4,27.1,1.2c9.1,0.7,18,2.1,26.9,4.1c4.5,1,8.9,2.6,13,4.6%20c2.2,1.1,4.1,2.5,5.8,4.2c1.9,1.9,3,4.4,3.1,7.1l0,0.8c0,0.3-0.1,0.7-0.2,1.1c-0.2,0.7-0.4,1.3-0.7,1.9c-0.6,1.1-1.3,2.2-2.1,3.1%20c-1.6,1.8-3.4,3.4-5.4,4.7c-3.8,2.6-7.8,4.9-12,6.9c-8.2,4-16.7,7.4-25.1,10.8c-8.4,3.4-16.8,6.6-25,10.2%20c-4.1,1.8-8.1,3.7-12,5.7c-4,2.2-11.9,5.7-12.8,10.9c-0.9,5.2,5.9,9.8,9.5,12.2c7.2,4.5,15.4,7.9,23.7,11.1%20c8.3,3.1,16.9,5.9,25.5,8.7c17.2,5.5,34.5,10.7,51.7,16.8c8.6,3,17.2,6.3,25.7,9.9c8.6,3.6,17,7.8,25,12.5%20c8.1,4.9,16,10.5,22.8,18c3.5,3.8,6.5,8.1,8.9,12.8c2.3,4.6,3.8,9.5,4.4,14.6c0.1,0.5,0.2,0.8,0.2,1.1l0.2,1%20c0.1,0.7,0.2,1.3,0.2,1.9c0.1,1.2,0.2,2.4,0.2,3.6c0.1,2.4,0,4.7-0.2,7.1c-0.4,4.6-1.4,9.2-2.7,13.7c-2.7,8.7-6.8,17-12.2,24.4%20c-5.2,7.3-11.2,13.9-17.9,19.8c-6.6,5.8-13.6,11-21,15.7c-7.4,4.7-14.8,8.5-22.2,12.4l-22.1,11.4c-14.7,7.5-29.2,15-43.6,22.7%20c-21.9,11.9-43.5,24.4-64,38.1h263.9C585.9,367.5,692.5,216,560.9,145.5'/%3e%3c/g%3e%3c/g%3e%3c/g%3e%3c/svg%3e)
New projections from the National Highway Traffic Safety Administration estimate that just under 42,800 people died in motor vehicle crashes in the United States in 2022. That’s a small decrease from the 42,939 road fatalities reported in 2021, a welcome sight after deaths increased sharply in both 2020 and 2021.
Still, despite apparent progress, the U.S. remains one of the deadliest developed countries in the world in terms of the fatality rate. 12.8 people died in a car crash for every 100,000 Americans, a slight downtick from the 12.9 people per 100,000 who died in crashes in 2021. That’s the highest rate out of 30 countries whose crash data was collected by the Organisation for Economic Cooperation and Development’s International Transport Forum.
At Dulin McQuinn Young, we worked with 1point21 Interactive to visualize car accident fatality rates around the world and put these numbers into context.
The deadliest roads
None of the developed countries tracked by the Organisation for Economic Cooperation and Development had higher rates of fatal road crashes in 2021 than the United States. Nearly 13 people per 100,000 were killed in collisions.
The circles are sized according to the accidents rate. The smaller the size, the fewer accidents rate was in a given country. Each circle represent one country.
➔ Hover over the lines to see country names and rates
The U.S. was also one of just three developed countries to have road deaths increase during the pandemic, according to OECD data reviewed by The New York Times. U.S. road deaths increased by 5% in 2020 compared to the yearly average from 2017 through 2019; Switzerland and Ireland were the other two countries with increases.
U.S. roads pose significant danger to motorcyclists and pedestrians
The United States has one of the five highest death rates out of a list of 30 developed countries for three specific types of crashes: crashes involving only passenger vehicles, crashes involving motorcycles and crashes involving pedestrians.
The only category where the U.S. is in the middle of the pack is crashes involving bicyclists, which likely reflects the country’s low usage of bikes as a way to get around. Nearly 60% of survey respondents in the Netherlands said they used their own bicycle for transportation at least twice a week as of 2021; in the U.S., the rate falls to just 13%.
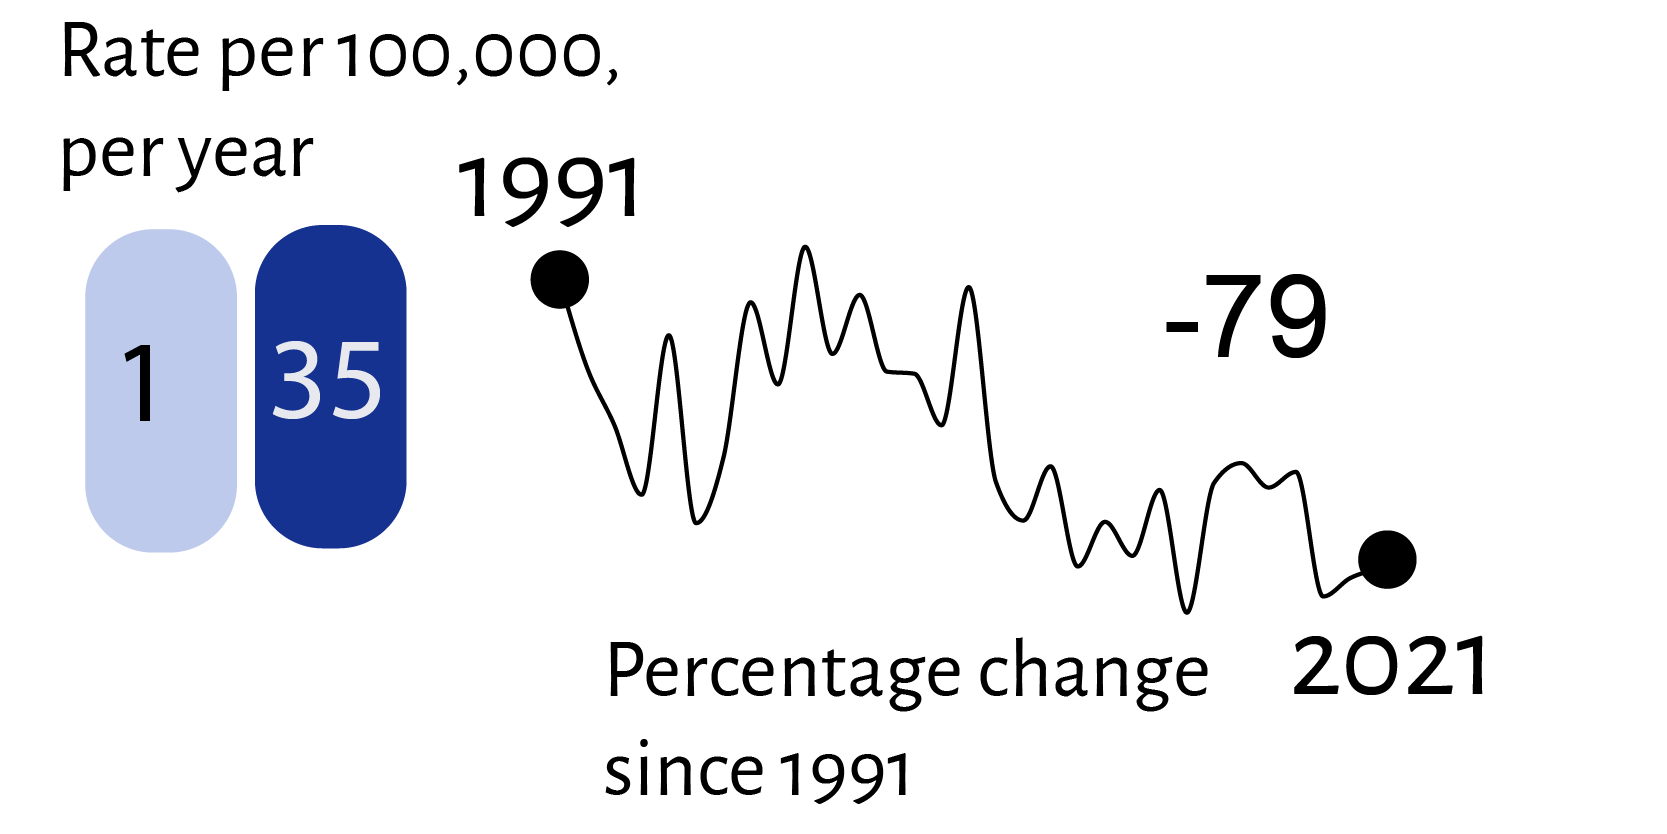
Despite the low ridership, fatal crashes involving cyclists are on the rise; so are fatalities involving motorcyclists and pedestrians. That’s a significant part of why, despite a sizable decrease in the rate of fatal crashes only involving passenger cars, overall fatal crashes have only decreased by 21% in the U.S. from 1991 to 2021.
Explore rates for each country in more detail
Pedestrian, motorcycle crashes keep overall fatal crash rate elevated in the U.S.
Lagging behind the pack
The rate of fatal car crashes has fallen since 1991 in all 30 of the developed countries reviewed by OECD. In 29 of those countries, the rate of fatal crashes decreased by at least 55%. In the U.S., they only dropped by 21%.
Why are crashes decreasing slower in the U.S. than in other countries? One reason could be that the United States has a more car-centric culture than other developed nations. Automobile regulations are stricter in many European countries, and American cities continue to prioritize cars rather than developing with pedestrians or bicyclists in mind.
Public transit usage patterns may also explain high rates of fatal crashes; the nonprofit American Public Transportation Association estimates that public transit riders have a 90% lower chance of being in an accident than car commuters do. Six of the 10 states with the lowest fatal crash rates in the U.S. are among the 15 most prolific users of public transit, while six of the 10 states with the highest fatality rates are in the bottom 15 for public transit usage, according to U.S. News & World Report.
Methodology and Data Sources
Data on crashes and crash rates comes from the Organisation for Economic Cooperation and Development’s International Transport Forum and the U.S. National Highway Traffic Safety Administration. U.S. state public transit usage rankings come from U.S. News & World Report’s Best States rankings and are based on the average number of miles traveled via public transit per resident in a year. Bicycle ridership statistics are from Statista’s Global Consumer Survey in 2021.
Feel free to republish the information from this story, but if you do, please provide attribution by linking back to this page.